


Most of us are seeing glaucoma patients on a regular basis and have been for a long period of time. Invariably we always are looking for stability in these patients, for as we know, it is not going to ‘get better.’ At best, the patient will remain stable, and if they do worsen over time, which many do, the progression is slow.
The challenge for us is being able to discern actual progression from inter-testing variability. This is especially true in patients we’ve seen for years, and even more so when those patients are generally very compliant with their care. In these cases, when progression occurs, it is often noted subtly; large dropoffs in visual field thresholds and structural changes don’t typically abruptly occur in well-controlled, compliant glaucoma patients.
Therefore, it is incumbent upon us to be able to detect change sooner rather than later, and in order to do so, we must evaluate visual fields and optical coherence tomography (OCT) images regularly. We know that visual fields carry more inter-testing variability than OCT measurements typically do.
Note in Figure 1 a subtle decrease in retinal nerve fiber layer (RNFL) thickness as seen in the progression analysis inferotemporally in the patient’s right eye. While progression can occur insidiously, this type of finding warrants further scrutiny.
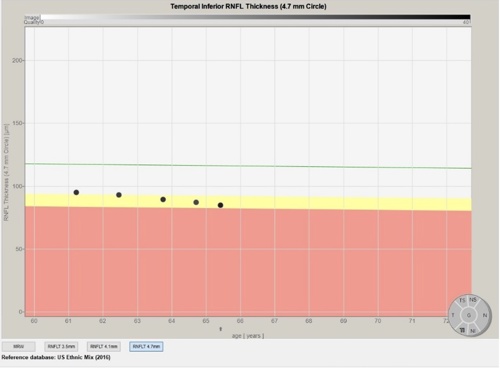
Of note, this progression trend is seen only in the inferotemporal sector of the RNFL, and not other areas, such as the superior temporal or global sectors of the RNFL. And interestingly, it is only seen in the RNFL scan furthest away from the optic nerve; namely, the 4.7 mm diameter scan.
In looking next at the neuroretinal rim inferotemporally in this same eye, we can see demonstrable thinning in the following image of the Bruch's membrane opening–minimum rim width (BMO-MRW) scan. (Figure 2)
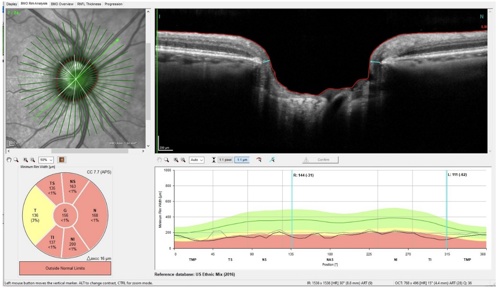
This is showing a 62 µm decrease in neuroretinal rim thickness in the inferotemporal sector of this optic nerve. That 62 µm decrease in neuroretinal robustness is rather significant, as compared to the subtle change seen in the progression analysis of the RNFL. In other words, there is a significant change in the neuroretinal rim, but a rather subtle change in the adjacent area of the RNFL scan.
Lastly, in looking at the ganglion cell layer thickness in this same eye, the full picture becomes evident. This is shown in Figure 3.
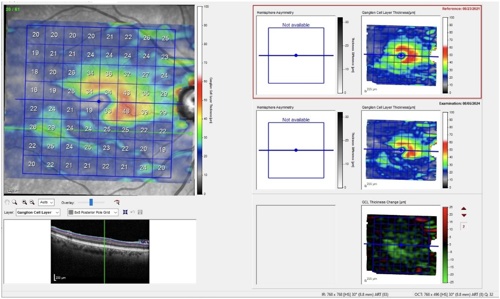
Note the change in ganglion cell thickness mapping from baseline, structurally matching to the change (thinning) of the neuroretinal rim and, to a lesser degree, the RNFL scan. Note also in this ganglion cell scan the subtle findings adjacent to the optic nerve inferotemporally, namely the relatively normal thickness map at the inferotemporal sector of the RNFL adjacent to the nerve.
That last point is important because adjacent to the optic nerve is exactly where most of our RNFL circle scans are obtained, and in this case, it looks relatively robust from a 10,000- foot-view. But as we know, the devil is in the details, and we are looking for changes in microns that make sense, rather than random inter-testing changes. This patient is a good example where a very subtle change in one small portion of the RNFL scan in one eye leads to further investigation, which clearly shows both concurrent and congruent change in the neuroretinal rim and ganglion cell layer.
The key here is to not just look at the RNFL scans alone without the context of the adjoining ganglion cell and BMO-MRW scans. Yes, this was a compliant patient, and yes progression did occur. But if we only looked at the RNFL scan superficially, we would have missed that progression and missed the opportunity to intervene early.

This content is supported by Heidelberg Engineering, Inc.