DIAGNOSTICS
Technology Improves Diagnostic Abilities
A look at some useful instruments for managing patients with optic disc
drusen.
by Scott A. Jens, O.D., F.A.A.O., Middleton, Wis.
Optic disc drusen (ODD) are hyaline bodies retained within the anterior optic nerve head structure. Often located anterior to the lamina cribrosa, ODD frequently become increasingly calcified with age. The earliest detection of ODD typically occurs in the patient's 20s, with the clinical presentation of elevated neuroretinal rim and irregular optic disc margins.
In some cases, early detection of optic disc drusen presents a clinical dilemma, as the minimally calcified hyaline deposits aren't ophthalmoscopically detectible. Many ophthalmic references suggest that B-scan ultrasonography is a highly effective diagnostic test in confirming the presence of the highly reflective ODD. Optical coherence tomography may be similarly helpful.
I'll point out the value in using the newest technology to diagnose and manage ODD.
Finding optic disc drusen
As patients age, optic disc drusen usually move anteriorly because of enlargement, as well as progressive loss of the nerve fiber axons. While you can find ODD in any portion of the optic disc, they're commonly nasal, and visual field defects have been reported corresponding to the location of the ODD within the disc. The visual field defects aren't necessarily diagnostic but can be progressive and permanent, while progressive axonal loss of the optic nerve can also lead to afferent pupillary defects, color vision deficiency and loss of visual acuity. Possible defects include enlarged physiologic blindspot, nasal step, sectoral and altitudinal defects.
Getting to know the tools
Today's diagnostic instrumentation that uses advanced computer technology can prove particularly helpful to the primary care optometrist in detecting and monitoring challenging clinical cases over the long term. Many progressive eyecare practitioners have increasing access to new technology visual field instruments, such as Carl Zeiss Meditec's Humphrey FDT (Frequency Doubling Technology) Visual Field Instrument, to accent the traditional automated bowl perimeter.
This is also true for specialized equipment such as the Stratus OCT 3 Optical Coherence Tomograph (Carl Zeiss Meditec). This instrument has applications for managing multiple ocular disorders, which I would argue, makes it a more worthwhile investment than other less diverse technologies.

|

|
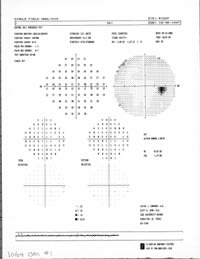
| Figure 1: In the right eye, the visual field shows no significant depressions related to the optic disc drusen. | Figure 2: In the left eye, we see an enlarged blind spot, superior arcuate defect and isolated inferior defect. |
Case in point
A compelling case report that demonstrates the value of the careful use of these current technologies is one of optic disc drusen in a 55-year-old white female, who recently presented for her annual comprehensive eye and vision examination. The patient, P.W., was a long-term rigid contact lens wearer who complained of foggy vision while wearing her multifocal design lenses.
Previous ocular history from medical records showed consistent notes regarding a left disc abnormality described as an "elevated irregular disc." The records demonstrate normal HFA II Central 40 Point Screening Test results using a two-zone strategy as recently as August 2000. In examinations I performed in 2001 and 2002, I noted a tentative diagnosis of ODD, considerably more evident in the left eye than in the right eye, in the record. I didn't pursue additional testing because of a history of normal screening visual fields and currently normal confrontational fields.
Putting the tools to use
Entering distance visual acuities to this examination was 20/20 for each eye. Color vision was normal using Ishihara plates, and pupil testing revealed equal, round, and reactive pupils without afferent pupillary defect. The routine testing of visual fields with an FDT perimeter had been recently initiated, using the C-20-5 Screening Strategy. The right eye was normal, but the left eye text revealed significant depression of the visual field that was substantially different than the historical screening fields.
In FDT's patented WelchAllyn technology, 17 grids within 30 degrees of central fixation are examined using a unique flickering stimulus that measures the function of magnocellular retinal ganglion cell/nerve fiber layer axons, which compromise only 3% to 5% of all retinal ganglion cells, allowing for early detection of visual field defects related to nerve fiber layer damage.
Screening strategy tests take as little as 30 seconds, while you can perform full threshold testing in four minutes. Testing is also convenient because patients may wear their habitual vision correction with no need for patching; further, you'll have no need to control ambient room lighting.
During the dilated examination, the discs were unchanged. The right disc revealed cup-to-disc (C/D) ratio of 0.25H/0.2V, with minimal cup depth and clear neuroretinal rim tissue; an isolated ODD was visually noted deep in the optic disc tissue at the five o'clock position.
The left disc had a C/D of 0.15 round with a flat cup profile, but significant disc elevation related to ophthalmoscopically-noted ODD in nearly the entire circumference of the neuroretinal rim. The remaining internal ocular structures were within normal limits, except for stable peripheral retinal lattice degeneration without retinal breaks in each eye.

|

|
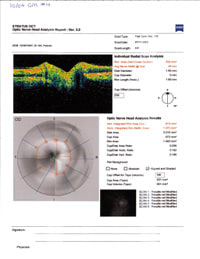
| Figure 3: Optic nerve head analysis shows significant elevation and mild darkness related to drusen. | Figure 4: More significant drusen than that found in right eye shows more profound elevation. |
Deciding how to proceed
Based on the FDT abnormality and stark contrast of that protocol compared to the historical automated screening fields, we reappointed the patient for threshold visual fields as well as for optic disc and nerve fiber layer assessments. The testing protocol for the HFA II evaluation was the Central 30-2 SITA-Standard Threshold strategy.
While the results of the right eye field were normal and consistent with the FDT result, the left eye field was compromised with an enlarged physiologic blind spot as well as arcuate defects in the superior and inferior zones; the superior defect demonstrating a mild nasal step appearance (see Figures 1 and 2). This result was strikingly similar to the FDT screening result, demonstrating the significant advantage of the FDT test in terms of accuracy via extremely short test time.
The OCT3 testing was done with two scan types, the Fast Optic Disc Scan and Optic Nerve Head Analysis (ver. 3.0) and Fast Retinal Nerve Fiber Layer Thickness Scan with RNFL Average Analysis (ver 3.0). The results were complimentary to the findings already demonstrated by the stereoscopic disc assessment and visual field testing, while standardized to allow for future comparisons (see Figures 3 to 5).
|
|
|
|
Figure 5: Mild RNFL depression right eye, and significant RNFL depression, left eye |
|
Reviewing the findings
In the optic nerve head analysis for the right eye, I noted a mild elevation in the inferior zone correlating to the visible ODD. This created a rim area within the vertical cross section of .332 mm2, which significantly exceeds the normal value of .180 mm2, as well as a vertical integrated rim area (vol.) of .813 mm3 again exceeding the norm of .300 mm3.
The retinal nerve fiber layer thickness average analysis revealed moderate depression of the retinal nerve fiber thickness of under the norm of 100 µm in the five o'clock (68 µm) and six o'clock zones (85 µm), again correlated to the location of the ODD.
Interestingly, there was no related FDT or HFA II superior visual field defect related to these disc and nerve fiber layer findings. In the optic nerve head analysis for the left eye, I noted a substantial optic disc drusen-related elevation in each meridian of the optic nerve scan.
Furthermore, there is interesting lack of scan penetration deep in the optic nerve beneath the ODD, resulting in a laser scan depression similar to the echo-depression in a B-scan ultrasound assessment of optic disc drusen. This created a rim area within the vertical cross section of .787 mm2, extremely exceeding the normal value of .180 mm2, as well as a vertical integrated rim area (vol.) of 1.817 mm3 (again extremely exceeding the norm of .300 mm3.)
The retinal nerve fiber layer thickness average analysis revealed extreme depression of the retinal nerve fiber layer thickness in eight of the 12 scanned zones (26 µm to 43 µm), likely caused by progressive axonal damage from the enlarging optic disc drusen.
We've appraised P.W. of the findings related to the optic disc drusen and we'll undertake annual monitoring with serial OCT3 assessments to measure for further changes.
Fortunately, the visual field defects related to optic disc drusen don't typically progress to symptomatic nor functional field loss. The value of the tomographic information goes well beyond that of stereoscopic disc photos and visual fields alone, since there can be statistical analysis of retinal nerve fiber layer thickness changes and predictive value of future field changes.
Evaluate the investment
For today's eyecare practitioner, investment in new technology is helpful in managing potentially alarming conditions such as ODD. The further diagnostic value in glaucoma as well as macular disease patients makes the technology all the more helpful in primary clinical practice to increase the level of service provided to patients and to increase the diagnostic clinical information you can convey to co-managing specialists.


