Fundus autofluorescence (FAF) images demonstrate the presence of excess fluorophores or the absence of retinal pigment epithelium (RPE).1-6 When fluorophore molecules are excited by light of the appropriate wavelength, they then emit light of a different wavelength. FAF focuses on detection of lipofuscin, described as a dominant fluorophore in the RPE, and which normally accumulates as a byproduct of the break-down of photoreceptor outer segments. Therefore, FAF can help reveal both RPE atrophic areas and areas of accumulated lipofuscin, which can indicate AMD or conditions such as Stargardt disease or the pattern dystrophies.
Abnormal and potentially pathological alterations in FAF images are termed either hyper-autofluorescent (brighter) or hypo-autofluorescent (darker). Hyper-autofluorescence (hyper-AF) suggests changes in lipofuscin (e.g., excessive accumulation of lipofuscin in the RPE), while hypo-autofluorescence (hypo-AF) suggests either a reduction in lipofuscin, as in cases where RPE cells are lost, or blockage of the view of the RPE and outer retina by accumulated material such as a hemorrhage.2,4,5
Here, we describe the funduscopic and FAF findings in three cases in which FAF contributed to a list of differential diagnoses. In all three cases, the condition has characteristics that could be consistent with several disorders, so the intent is to describe the thinking behind generating a list of differential diagnoses. All the patients had only mild blur or no visual complaints, and were subsequently found to have changes in the retina during their eye examination. FAF played a significant role in assessing the extent of these retinal changes and in generating differential diagnoses. A caveat: The differential list is not meant to be all inclusive. Additionally, all these cases require monitoring for progression.
CASE 1: STARGARDT OR OTHER RETINAL DYSTROPHIES?
Patient: A 52-year-old male patient diagnosed 14 years prior with Stargardt disease presented with complaints of mild blurred vision. The best corrected visual acuity was 20/20 in both eyes.
The following discussion focuses on the autosomal recessive variant of Stargardt (STGD1).3,7
The funduscopic changes in Stargardt disease may include varying degrees of chorioretinal atrophy that appear in a bull’s eye pattern encircling the fovea. Such a pattern may consist of an inner ring of chorioretinal atrophy; as Stargardt disease is a lipofuscinopathy, a generalized darkening of the retina may also occur due to accumulation of lipofuscin in the RPE. On fluorescein angiography, this darker area may block the background choroidal fluorescence, resulting in the so-called dark choroid. Sometimes, these macular changes are surrounded by yellow, round or pisciform (“fish-tail”) flecks that spare the peripapillary area. The electroretinogram (ERG) may be mildly reduced in Stargardt disease and the electro-oculogram (EOG) may be abnormal.8-10
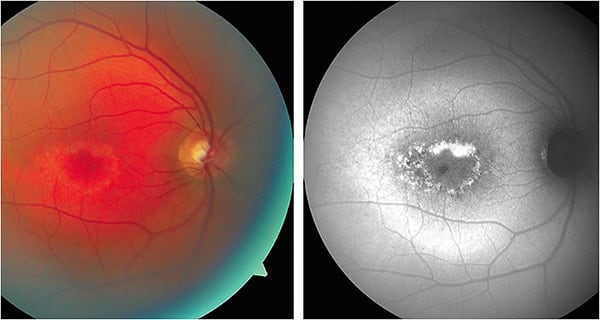
Test findings: The good acuity suggested that the fovea was likely intact in both eyes, but fundus photographs showed areas of RPE atrophy encircling the macula with some yellow deposits, particularly on the temporal border of the dull yellow atrophic areas.
The FAF images for this patient (Figure 1) displayed hyper-AF areas that followed the distribution of the RPE atrophy noted in the clinical photographs. The flecks noted in the fundus photographs were hyper-AF, suggesting that they were the result of accumulation of lipofuscin. Interspersed within the areas of hyper-AF were areas of hypo-AF. Overall, these findings demonstrated that regions of RPE atrophy were intermixed with regions where remaining RPE cells with abnormal accumulations of lipofuscin.

Conclusions: While these results are consistent with Stargardt disease, other retinal dystrophies that lead to accumulation of lipofuscin must be considered, such as retinal pattern dystrophies.11,12 The circular atrophic area in each macula of the patient can be characteristic of Stargardt disease, but the age of onset and the good VA are consistent with pattern retinal dystrophies. The hyper-AF in the autofluorescence images could also appear in both Stargardt and pattern dystrophies.2,11,13
FAF helped establish the extent of the retinal changes and the likelihood that the disorder was Stargardt disease, but there are additional variables that could help reach a more definitive diagnosis. These include the patient’s family pedigree (pattern dystrophies are inherited in autosomal dominant fashion although with incomplete penetrance), genetic testing, electrodiagnostic testing, and fluorescein angiography. The patient was to be followed in one year as the condition was stable.
CASE 2: PISCIFORM FLECKS DETECTED
Patient: A 57-year-old male patient with no visual complaints presented for a routine eye examination to assess his old spectacles.
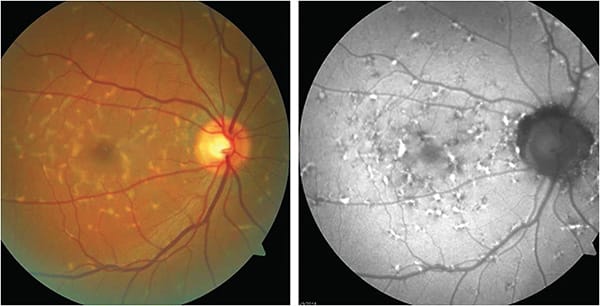
The BCVA in this patient was 20/20 in both eyes. Fundus photographs demonstrated a number of yellow-orange pisciform flecks throughout the posterior pole of both eyes. These clinical features are often associated with Stargardt disease.8,10,14-17
Test findings: OCT images showed hyper-reflective “bumps” in the RPE of both eyes, presumably associated with accumulation of lipofuscin in areas of the yellow-orange flecks. There appeared to be some hyper-reflective areas anterior to the “bumps” in or near the outer plexiform layer.
FAF images for this patient (Figure 2) showed hyper-AF corresponding with yellow-orange flecks. Many areas of hyper-AF were adjacent to areas of hypo-AF. Hypo-AF associated with peripapillary atrophy was apparent in both eyes. These FAF findings can be characteristic of Stargardt.

Conclusions: Given the extent of the lesions noted clinically and by FAF, the patient was referred to a retinal specialist in order to obtain more testing and perhaps a more definitive diagnosis and prognosis. Electrodiagnostic testing was performed. The cone-mediated ERG results were characterized as low normal with normal peak range times. The rod-mediated ERG results showed a decrease in amplitude of about 35% compared to normal and what was described as “a higher limit of normal peak time.” The rod/cone-mediated ERGs were decreased in amplitude by about 25% compared to normal with normal peak time.
The retinal specialist concluded that the clinical picture was most consistent with Stargardt disease. Genetic testing was recommended. Differential diagnoses include the pattern dystrophies.
While this patient had characteristics of Stargardt disease (the pisciform flecks, fundus autofluorescent pattern, electrodiagnostic testing results, and OCT findings), all these test results are possible in both Stargardt and pattern dystrophy. On the other hand, the apparently older age of onset and VA seem more consistent with a pattern dystrophy.
CASE 3: HYPO-AF MIXED WITH HYPER-AF
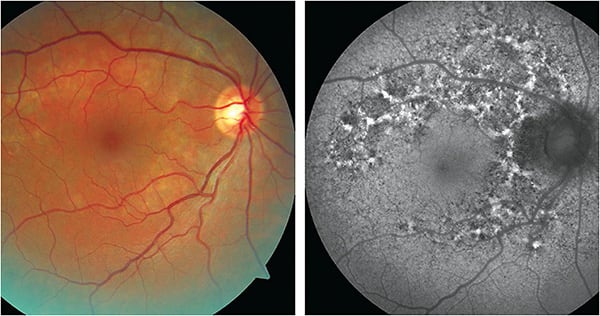
Patient: A 47-year-old male presented complaining of blur at intermediate distances. His BCVA was 20/20 in both eyes. Retinal photographs demonstrated dull yellow atrophic areas. Some of the atrophic areas were associated with pigment clumping. In OCT images, there were some areas of RPE disruption adjacent to the fovea in each eye. No areas of retinal atrophy were noted in an examination two years prior.
Test findings: The FAF images (Figure 3) demonstrated multiple areas of hypo-AF. While these areas corresponded to some degree with the atrophic areas noted in the clinical photographs, the atrophic areas noted on FAF were more extensive than what may have been expected from the clinical photographs. Many of these areas were inter-mixed with, or perhaps surrounded by, areas of hyper-AF. In both eyes, the macula appears to be spared.

Conclusions: Given the extent of the changes seen on FAF and the fact that the retinal changes were not documented 2 years prior, we referred the patient to a retinal specialist to determine the likelihood that this was a progressive (perhaps inflammatory) condition, at which time fluorescein angiography was performed.
On the fluorescein angiogram, there were many zones of hyperfluorescence associated with areas of RPE atrophy surrounding the macula and extending into the mid-periphery. These hyperfluorescent areas corresponded to hypo-AF areas on the FAF images. Between these hyperfluorescent areas were hypofluorescent spots or lines. The hypofluorescence corresponded to areas of hyper-AF on the FAF images. The retinal specialist concluded that the retinal findings did not suggest an “active process,” which presumably means there was no active inflammation at that time.
Given the late onset of this disorder and the patient’s good VA, these findings may be consistent with a pattern dystrophy, although macular sparing may or may not occur with these disorders.11,12,18
Another possibility, given the age of onset and the distribution of the atrophic areas, is his retinal changes could have resulted from a group of differentials termed idiopathic chorioretinopathies.2,9 Given that a firm diagnosis is difficult to obtain, and that re-inflammation is possible, the patient is to be followed every 6 months.
ARRIVING AT THE RIGHT DIAGNOSIS
FAF may help optometrists in differentiating atrophic RPE disorders, and may demonstrate greater RPE and retinal disease than is apparent from the clinical appearance. Additionally, FAF has been advocated as a part of “multimodal imaging,” where it is used in conjunction with tests such as OCT and fluorescein angiography when a specific diagnosis is challenging to obtain.8,11,19-21 A more definitive diagnosis can likely provide patients with a more accurate visual prognosis. Finally, FAF is a sensitive method to monitor for stability or progression once a retinal condition is discovered. OM
REFERENCES
- Schmitz-Valckenberg S, Holz FG, Bird AC, Spaide RF. Fundus autofluorescence imaging: Reviews and perspectives. Retina. 2008;28:385-409. doi:10.1097/IAE.0b013e318164a907
- Yung M, Klufas MA, Sarraf D. Clinical applications of fundus autofluorescence in retinal disease. Int J of Retina Vitreous. 2016;2:12. Published 2016 Apr 8. doi:10.1186/s40942-016-0035-x
- Pichi F, Abboud EB, Ghazi NG, Khan AO. Fundus autofluorescence imaging in hereditary retinal diseases. Acta Ophthalmol. 2018;96(5):e549-e561. doi:10.1111/aos.13602
- Booysen DJ. A review of fundus autofluorescence imaging. S Afr Optom. 2013;72:46-53.
- Frampton GK, Kalita N, Payne L, et al. Fundus autofluorescence imaging: systematic review of test accuracy for the diagnosis and monitoring of retinal conditions. Eye (Lond). 2017;31(7):995-1007. doi:10.1038/eye.2017.19
- Calvo-Maroto AM, Cerviño A. Spotlight on fundus autofluorescence. Clin Optom (Auckl). 2018;10:25-32. Published 2018 Mar 27. doi:10.2147/OPTO.S134637
- Donato L, Scimone C, Rinaldi C, et al. Stargardt Phenotype Associated With Two ELOVL4 Promotor Variants and ELOVL4 Downregulation: New Possible Perspective to Etiopathogenesis? Invest Ophthalmol Vis Sci. 2018;59:843-857.
- Mukherjee N, Schuman S. Diagnosis and management of Stargardt disease. EyeNet Magazine (American Academy of Ophthalmology). 2014;December:29-31.
- Bowling B. Kanski’s Clinical Ophthalmology: A Systematic Approach. 8th ed. W.B. Saunders; 2015.
- Tsang SH, Sharma T. Stargardt disease. In: Tsang SH, Sharma T, eds. Atlas of Inherited Retinal Diseases, Advances in Experimental Medicine and Biology 1085. Springer;2018:139-151.
- Crane ER, Bass SJ. Case Series: Multimodal Imaging Reveals the Spectrum of Pattern Dystrophies of the Retinal Pigment Epithelium. Optom Vis Sci. 2019;96:314-321. doi:10.1097/OPX.0000000000001361
- Hamilton JR, Burke CL. Pattern recognition: How to Identify and Confirm Multifocal Pattern Dystrophy. Review of Optometry. December 15, 2015. https://www.reviewofoptometry.com/article/pattern-recognition-how-to-identify-and-confirm-multifocal-pattern-dystrophy. Accessed Aug. 31, 2022.
- Boon CJ, Jeroen Klevering B, Keunen JEE, Hoyng CB, Theelen T. Fundus autofluorescence imaging of retinal dystrophies. Vision Res. 2008;48:2569-2577. doi:10.1016/j.visres.2008.01.010
- Armstrong JD, Meyer D, Xu S, Elfervig JL. Long-term follow-up of Stargardt’s disease and fundus flavimaculatus. Ophthalmology. 1998;105(3):448-457. doi:10.1016/S0161-6420(98)93026-3
- Westeneng-van Haaften SC, Boon CJ, Cremers FP, Hoefsloot LH, den Hollander AI, Hoyng CB. Clinical and genetic characteristics of late-onset Stargardt’s disease. Ophthalmology. 2012;119(6):1199-210. doi:10.1016/j.ophtha.2012.01.005
- van Huet RA, Bax NM, Westeneng-Van Haaften SC, et al. Foveal sparing in Stargardt disease. Invest Ophthalmol Vis Sci. 2014;55(11):7467-7478. Published 2014 Oct 16. doi:10.1167/iovs.13-13825.
- Lambertus S, Lindner M, Bax NM, et al; Foveal sparing Atrophy Study Team (FAST). Progression of Late-Onset Stargardt Disease. Invest Ophthalmol Vis Sci. 2016;57(13):5186-5191. doi:10.1167/iovs.16-19833.
- Marmor MF, McNamara JA. Pattern dystrophy of the retinal pigment epithelium and geographic atrophy of the macula. Am J Ophthalmol. 1996;122:382-392. doi:10.1016/s0002-9394(14)72065-3.
- Weidmayer S. AMD Mimickers: When to suspect macular dystrophy. Review Education Group. https://www.reviewsce.com/ce/amd-mimickers-when-to-suspect-macular-dystrophy. Accessed Aug. 31, 2022
- Knickelbein JE, Sen HN. Multimodal Imaging of the White Dot Syndromes and Related Diseases. J Clin Exp Ophthalmol. 2016;7(3):570. doi:10.4172/2155-9570.1000570
- Raven ML, Ringeisen AL, Yonekawa Y, Stem MS, Faia LJ, Gottlieb JL. Multi-modal imaging and anatomic classification of the white dot syndromes. Int J Retina Vitreous. 2017;3:12. Published 2017 Mar 20. doi:10.1186/s40942-017-0069-8


