Given that the prevalence of diabetes in the United States is on the rise and glycemic control is on a worsening trend, there is concern for the increasing rate of the ocular microvascular complication diabetic retinopathy (DR).1,2 In fact, a recent study shows that one in four individuals (26.4%) with diabetes has DR.3 What’s more, vision-threatening DR was estimated in 5.06% of those with diabetes.3
With prevalence on the rise, recognizing the early signs of diabetic eye disease is critical for intervention. As such, the following diagnostic devices can aid in the detection of nonproliferative, or early stage DR. Early detection and proper education (see “Elevated DR Risk Factors,” in the online version of this article) results in better outcomes for our patients with diabetes.
Fundoscopy
Fundus exam through a dilated eye is essential to identify DR. Often, the earliest clinical sign of diabetic retinopathy is microaneurysm formation. This is best appreciated with a slit lamp exam using a 78 D or 90 D fundoscopy lens. Early DR can also be seen in the peripheral retina. One study shows approximately one-third of DR lesions were found outside the Early Treatment Diabetic Retinopathy Study’s (ETDRS) seven standard imaging fields.4
Clinical pearls. Patients with diabetes require yearly dilation. The exam should consist of two components: a slit lamp exam with a fundoscopy lens to assess for changes in the posterior pole and a binocular indirect ophthalmoscope to avoid missing peripheral DR. A 78 D fundoscopy lens provides high magnification, which may aid the OD in visualizing subtle microaneurysms better.
Photography
Fundus photos, whether a traditional 30° image or widefield, offer an opportunity to document retinopathy as well as scrutinize for subtle nonproliferative and proliferative changes. Historically, DR was assessed via the seven standard fields proposed by the ETDRS, which offered a 75° view of the fundus. Nowadays, widefield imaging devices offer a view of 200°, allowing clinicians a full assessment of the peripheral fundus. A total of 70% of retinal nonperfusion in DR is found outside the posterior pole, emphasizing the importance of assessing the retinal periphery.5
Many imaging devices also offer other features, such as red-free capabilities and fluorescein angiography. Red-free images, taken with a green wavelength, enable the view of vasculature and, as such, highlight DR lesions.6
Clinical pearls. Fundus photography offers a supplement to a keen clinical exam. Camera options range widely from traditional digital cameras, to portable handheld units with smartphones. Widefield imaging platforms using confocal scanning laser ophthalmoscope allow for spotting the earliest changes in DR and can be used as a patient education tool to encourage glycemic control.
Optical coherence tomography (OCT)
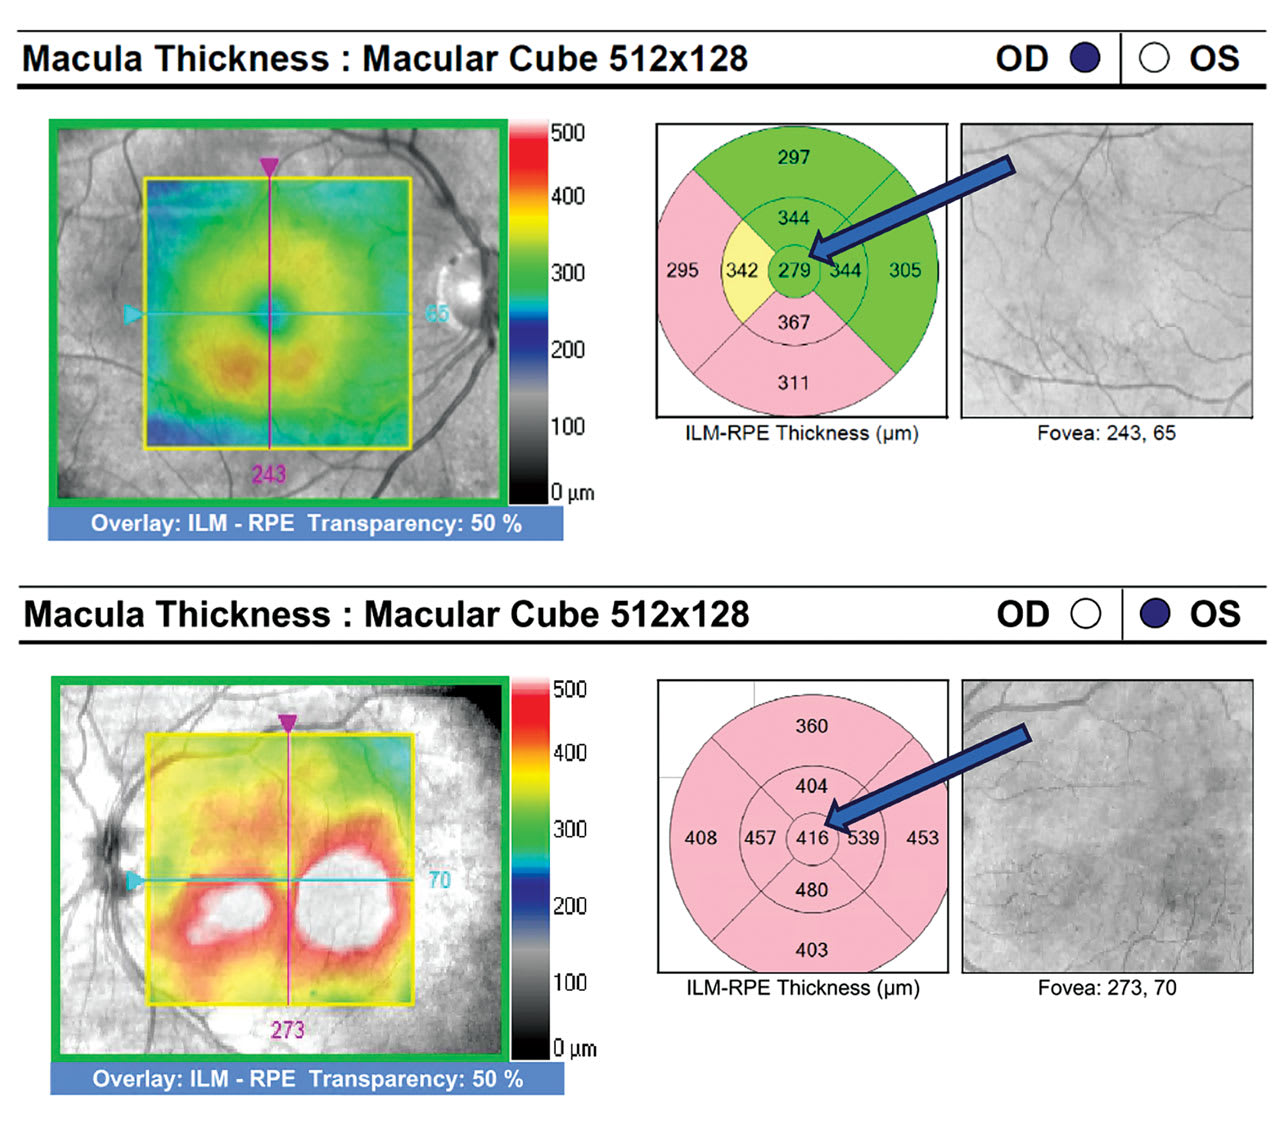
OCT is most helpful in assisting in the detection and quantification of diabetic macular edema (DME), which can occur at any stage of retinopathy.
Clinical pearls. The optometrist should order OCT for any diabetic patients who have either unexplained reduced visual acuity or clinical suspicion of DME, such as microaneurysms and hard exudates. If the OD notes DME on OCT, they should classify it as either non-center involved DME (non-CI DME) or center-involved DME (CI DME). CI DME appears as thickening within the central subfield zone, the central 1 mm diameter of the ETDRS circle (Figure 1). Intervention for CI DME depends on the discretion of the retinal specialist factoring in the extent of edema, as well as the patient’s best-corrected visual acuity (BCVA).7 Alternatively, diabetic patients who have non-CI DME can remain under observation with the optometrist following with OCT every 3 to 4 months.

OCT-angiography
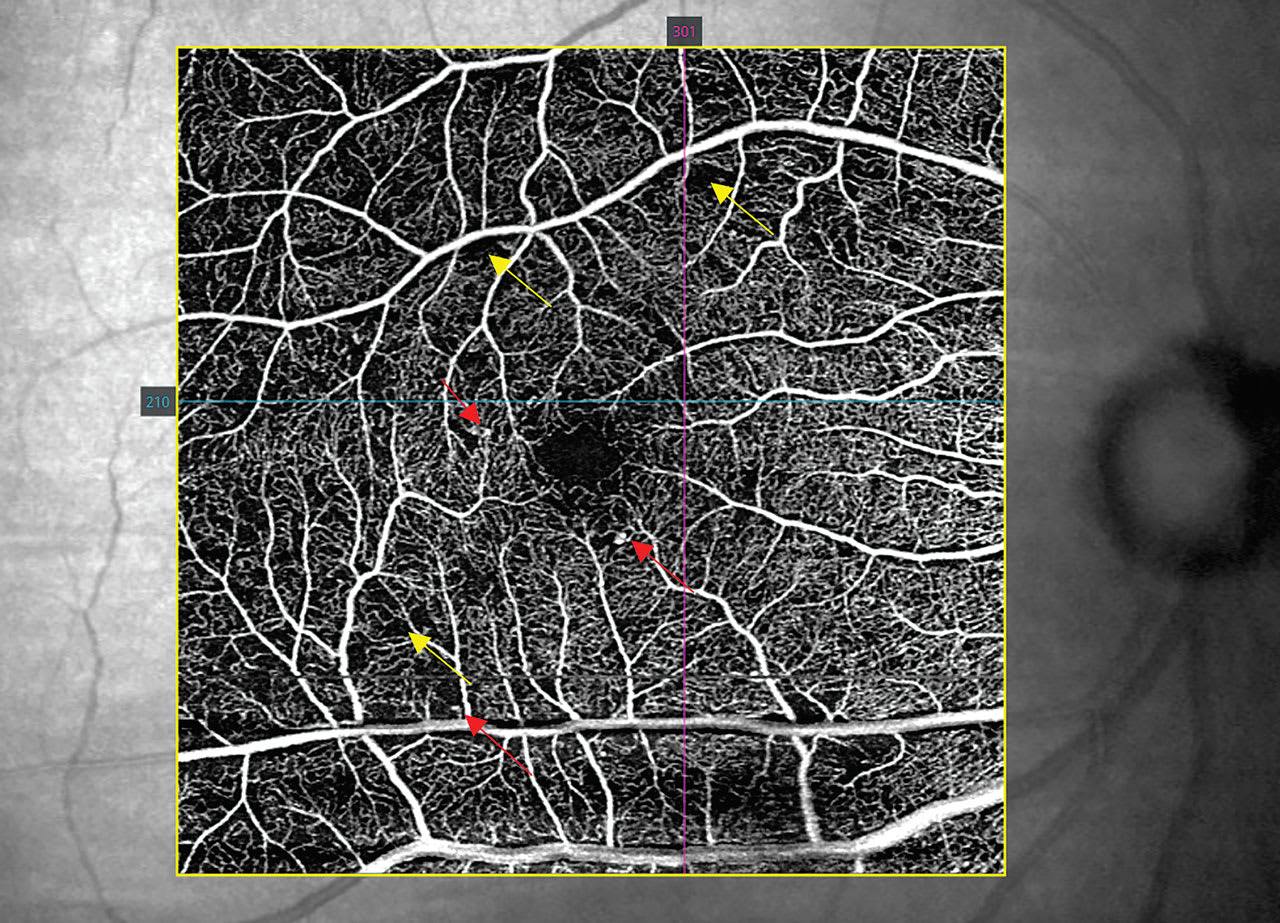
When it comes to preclinical detection, OCT-angiography, or OCT-A, assists the OD in uncovering early retinopathy changes, such as microaneurysms and capillary dropout. OCT-A uses motion contrast to map retinal and choroidal blood flow by detecting the movement of red blood cells in the vasculature. In particular, the superficial and deep capillary plexus are the most important OCT-A en face slabs to analyze in diabetic individuals.
Clinical pearls. There are three key parameters to screen for when using OCT-A to look for pre-clinical and clinical DR: the foveal avascular zone (FAZ), microvascular anomalies, and the integrity of the capillary network.
The optometrist should start by assessing the FAZ, which is round and distinct in normal individuals.8 With DR, the size of the FAZ increases, correlating with disease severity, and the contour of the FAZ becomes irregular.9,10 Not all OCTA manufacturers have the software to measure FAZ, but the contour can still be assessed for circularity.

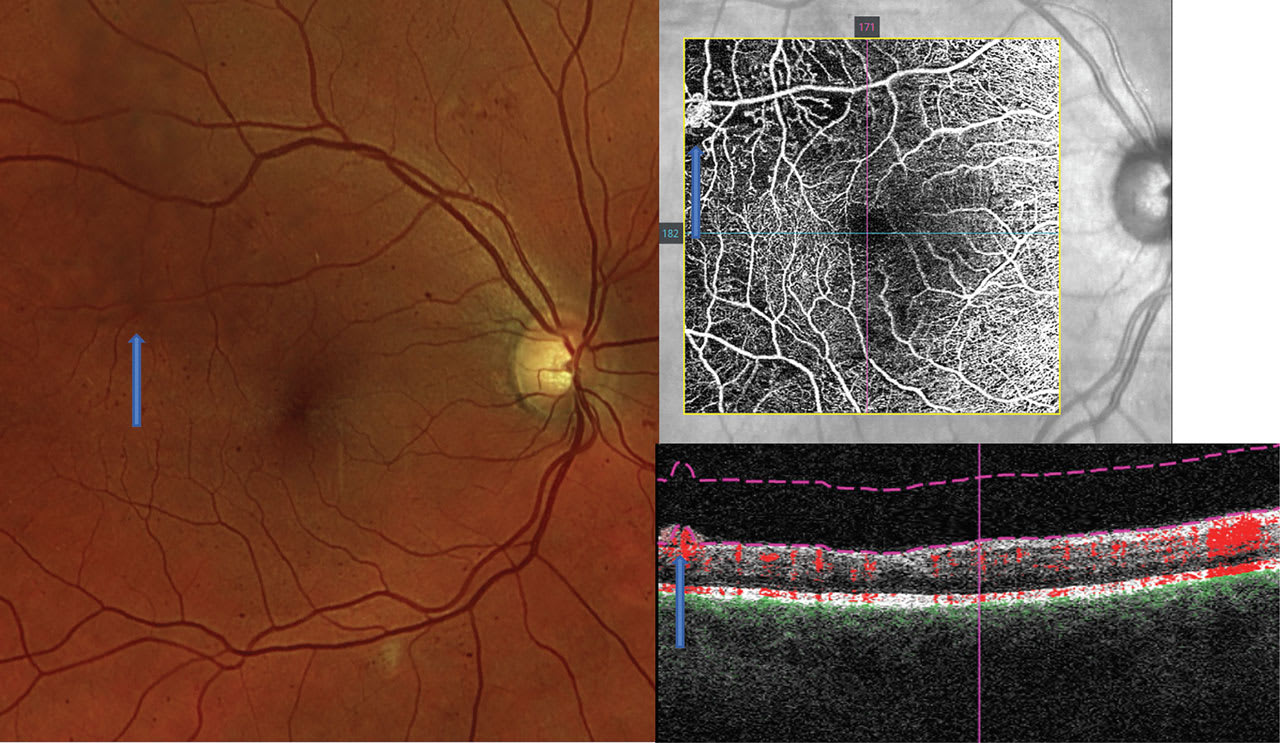
Next, the clinician should review the OCT-A for microaneurysms and anomalous vessels, which are typically hyper-reflective on the capillary plexus slabs, as long as there is sufficient blood flow through the anomalies8 (Figure 2). If there are concerns for proliferative disease, OCT-A is also helpful in discriminating intraretinal microvascular anomalies from neovascularization (NVE): On OCT-A B-scans, NVE breaches the vitreoretinal interface, which differentiates the two (Figure 3).
Lastly, the optometrist should look for capillary dropout, which is demonstrated on OCT-A in areas void of vasculature, indicating ischemia and nonperfusion. The extent of the dropout increases with DR stage severity.9 Further, large areas of capillary nonperfusion are at risk for NVE formation (Figure 3).

Electroretinogram (ERG)
This provides a means to objectively detect retinal dysfunction caused by diseases, such as DR and glaucoma. In DR, neuroretinal dysfunction detected via multifocal ERG can be seen before microvascular manifestations of the condition.10,11 The early changes show a delay in the implicit time, a measure of the time needed for the electrical response to attain maximum amplitude. In one study, the location of implicit time delays matched with later microaneurysm and hemorrhage development with a 73% sensitivity and a 77% specificity.11
Clinical pearls. ERG as a technology has re-emerged with noninvasive handheld or portable devices now obtainable. These can be used in screening those at risk for DR, and play a role in flagging the individuals who are likely to progress to a stage necessitating DR treatment. One such handheld ERG device has created a DR assessment and score report. A score is generated from four components: implicit time, amplitude, pupil response and age. The cutoff score equated to 23.5, as those above that were 11 times more likely to have a subsequent need for ocular treatment (anti-VEGF, laser, or surgery) within 3 years than those under that mark.12
Contrast sensitivity tests
Aside from ERG, other means of functional assessment that may be employed include testing color perception and contrast sensitivity. Diabetes causes retinal S-cone damage and, as such, some develop tritan deficits, affecting blue-yellow color vision.13, 14
Reduced contrast sensitivity, as well, has been documented in DR patients and those diabetics without retinopathy.15 A caveat: The results of these functional tests may be confounded with the presence of other retinal or optic nerve disease.
Early intervention
ODs are at the forefront of diabetic eye disease management. A thorough clinical exam coupled with state-of-the-art diagnostic technology allows for early DR recognition and timely intervention for a potentially vision-threatening condition. OM
References
1. Age-Related Macular Degeneration Preferred Practice Pattern – Updated 2015. American Academy of Ophthalmology website. https://www.aao.org/preferred-practice-pattern/age-related-macular-degeneration-ppp-2015 Updated Jan. 2015. Accessed March 12, 2018.
2. Oellers P, Lains I, Mach S, et al. Novel grid combined with peripheral distortion correction for ultra-widefield image grading of age-related macular degeneration. Clinical Ophthalmology. 2017;11:1967-1974.
3. Davey PG, Alvarez SD, Lee JY. Macular pigment optical density: repeatability, intereye correlation, and effect of ocular dominance. Clin Ophthalmol. 2016;10:1671-1678.
4. Owsley C, McGwin G, Cleark ME, et al. Delayed rod-mediated dark adaptation is a functional biomarker for incident early age-related macular degeneration. Ophthalmology. 2016;123:344-351.
5. Delori FC, Dorey CK, Staurenghi G, Arend O, Goger DG, Weiter JJ. In vivo fluorescence of the ocular fundus exhibits retinal pigment epithelium lipofuscin characteristics. Investigative Ophthalmology & Vision Science. 1995;36:718–729.
6. Schmitz-Valckenberg S, Fleckenstein M, Gobel AP, et al. Evaluation of autofluorescence imaging with the scanner laser ophthalmoscope and the fundus camera in age-related geographic atrophy. American Journal of Ophthalmology. 2008;146:183-192.
7. Roberts PK, Baumann B, Schlanitz FG, et al. Retinal pigment epithelial features indicative of neovascular progression in age-related macular degeneration. British Journal of Ophthalmology. 2017;101:1361-1366.
8. Dansingani KK, Gal-Or O, Sadda SR, et al. Understanding aneurysmal type 1 neovascularization (polypoidal choroidal vasculopathy): a lesion in the taxonomy of ‘expanded spectra’-a review. Clinical & Experimental Ophthalmology. 2017 Nov 25 [Epub ahead of print] doi: 10.1111/ceo.13114.
9. Schmitz-Valckenberg S, Sahel JA, Danis R, et al. Natural history of geographic atrophy progression secondary to age-related macular degeneration (Geographic Atrophy Progression Study). Ophthalmology. 2016;123:361-368.
10. De Oliveira Dias JR, Zhang Q, Garcia JMB, et al. Natural history of subclinical neovascularization in nonexudative age-related macular degeneration using swept-source OCT angiography. Ophthalmology. 2018;125:255-266.
11. Midena E, Pilotto E. Microperimetry in age: related macular degeneration. Eye (Lond). 2017;31:985-994.
12. Gao SS, Jia Y, Zhang M, et al. Optical Coherence Tomography Angiography. Investigative Ophthalmology & Vision Sciences. 2016;57:27-36.
13. Zhang B, Li N, Kang J, et al. Adaptive optics scanning laser ophthalmoscopy in fundus imaging, a review and update. Int J Ophthalmol. 2017;10:1751-1758.
14. Kang EYC, Chen TH, Garg SJ, et al. Association of Statin Therapy With Prevention of Vision-Threatening Diabetic Retinopathy. JAMA Ophthalmol. 2019;137(4):363-371. doi: 10.1001/jamaophthalmol.2018.6399.
15. Chew EY, Davis MD, Danis RP, et al. The effects of medical management on the progression of diabetic retinopathy in persons with type 2 diabetes: the Action to Control Cardiovascular Risk in Diabetes (ACCORD) Eye Study. Ophthalmology. 2014;121:2443-51. doi: 10.1016/j.ophtha.2014.07.019.


